- In Bezug auf Graphen: Was ist übersichtliche Darstellung? (neu @ 20040704)
- In Bezug auf Graphen: Welchen tieferen Sinn hat übersichtliche Darstellung? (neu @ 20040704)
- Was ist ein "Spanning Tree"? (nicht beantwortet @ 20040703) (neu @ 20040704)
- Warum an die Thesaurus-Visualisierer die Kriterien anlegen, ob die betreffende Software auf Charakteristika der Domäne Thesaurus eingeht, ob die Auswahl des Visualisierungsverfahrens und das Layouten des Graphs der Aufgabe angemessen ist? (neu @ 20040704)
- Kriterium für die Visualisierung von Bäumen (neu @ 20040704)
- Welches Layouting-Verfahren benutzt H3? (neu @ 20040704)
- Update @ 20040705: Wie umfangreich können die Graphen sein, die von dem jeweiligen Visualisierer gehandhabt werden können?
- Was ist Graph-Visualisierung?
- What is Graph Visualization?
- Graph-Visualisierung: Thinkmap-White-Papers
- Graph-Visualisierung: Munzner: H3, Literatur- und Software-Links; Biographie
- Munzner: Präsentationen
- Graph-Visualisierung: Diverses, Walrus
- verwendbare Teile von Munzners PhD
- 20040627: via CiteSeer New Developments in Geometric Graph Theory, 1993
Posts mit dem Label Graphen werden angezeigt. Alle Posts anzeigen
Posts mit dem Label Graphen werden angezeigt. Alle Posts anzeigen
11.6.04
Zsfg. Graph-Visualisierung (Papers, Präsentationen)


7.6.04
Zsfg. interaktive Graph-Visualisierer
- von der TouchGraph Homepage: The field of Graph Based Interfaces is still in it's infancy... Touch Graph ist kein HTV, aber ein Sourceforge-Projekt.
- A graph based information retrieval framework for the visualization ... Users, interactively, may refine their queries by selecting the graph nodes. Then, the context of the users interaction is calculated and it is shown in a tree-structure. Hierbei handelt es sich um ein Projekt, das AFAIK im kostenpflichtigen Teil von Springer LINK liegt; alternativ ist das Original verfügbar, allerdings auf Portugiesisch; und dafür habe ich kein brauchbares Dictionary gefunden.
- Graphen-Visualisierer Dieser Link geht gen Däßlers Institut fabdp, auf Prototypen. Einige davon sind bereits aus InfoVis99 bekannt. Die Liste enthält einige dead links.
31.5.04
ein schlechtes Bsp. für einen HTV
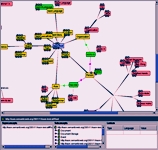
Beispiel für einen HTV, der nicht morpht und bei dem der die Postionen der angeklickten Knoten von den Positionen der schließlich hervorgehobenen deutlich abweicht: Nach jedem Schritt (= Anklicken) muss man erstmal mit den Augen das Fenster absuchen, um die neue Position des soeben angeklickten Knotens zu finden.
HTV-Beschreibung
"Hyperbolic graph layout uses a context + focus technique to represent and manipulate large tree hierarchies on limited screen size. Hyperbolic trees are based on Poincare's model of the (hyperbolic) non-Euclidean plane. Experience non-Euclidean Geometry with Paul Garrett's applet! John Lamping, Ramana Rao and Peter Pirolli rediscovered hyperbolic spaces in 1995 for information visualization. Tamara Munzner at Stanford University developed a 3D hyperbolic viewer in her Ph.D. thesis.
The hyperbolic layout employs the following techniques:
(Quelle @ 20040531.00-56, Abschnitt "Description")
The hyperbolic layout employs the following techniques:
- Radical Layout: Conventionally, trees are displayed on a Euclidean plane with the root at the top and children below their parents and connected to their parents with edges. The hyperbolic layout uses a radical layout. The root is placed at the center while the children are placed at an outer ring to their parents. The circumference jointly increases with the radius and more space becomes available for the growing numbers of intermediate and leaf nodes.
- Distortion Technique: Hyperbolic layout uses a nonlinear
(distortion) technique to accommodate focus and context for a large number of nodes. - Non Overlapping:To ensure that nodes do not overlap each other, hyperbolic layout algorithms assign an open angle for each node. All children of a node are laid out in this open angle.
- Refocusing: Transformations are provided to allow fluent node repositioning. Users can click on a node to move it to the center or to grab and reposition a single node."
(Quelle @ 20040531.00-56, Abschnitt "Description")
30.5.04
SIS weist definitiv >= 1 Graph-Visualisierung von Thesaurus-Strukturen auf
Das Semantic Index System (SIS) weist definitiv eine Graph-Visualisierung von Thesaurus-Strukturen auf: vgl. SIS - Graphical Analysis Interface User's Manual (word file 433 KB; Quelle; lokal: gain_user.doc)
Contact Person: Martin Doerr
Contact Person: Martin Doerr

28.5.04
noch ein paar Google-Recherchen...
- visualize thesaurus.structure -visual.thesaurus: 15 Treffer
- thesaurus.structure visualization -visual.thesaurus: 84 Treffer
- thesaurus navigation visual -visual.thesaurus: ca. 20 000 Trefer
- -
- thesaurus.management.software: 338 Treffer
- thesaurus.management.software visual: 67 Treffer
- thesaurus.management.software visualize: 7 Treffer
- thesaurus.management.software visualization: 29 Treffer
- -
- thesaurus.management implementation visual: 131 Treffer
- thesaurus.management implementation visualize: 8 Treffer
- thesaurus.management implementation visualization: 40 Treffer
- -
- visual.research thesaurus: 197 Treffer
- -
- visuelle.recherche thesaurus: 3 Treffer
- visual.research.methods thesaurus: 5 Treffer
- -
- visual.research thesaurus -visual.research.file -visual.thesaurus: 133 Treffer
- visual.research thesaurus -visual.research.file -visual.thesaurus graph: 67 Treffer
- visual.research thesaurus -visual.research.file -visual.thesaurus structure: 80 Treffer
- visual.research thesaurus -visual.research.file -visual.thesaurus navigation: 12 Treffer
27.5.04
Know It All-Treffer
Hm, anscheinend habe ich die Treffer von KnowItAll nicht notiert. Daher der Nachtrag:
- Visually Navigate Information Spaces and Taxonomies - Robin Good' ...
... visualization engine powering the Visual Thesaurus has been ... of Plumb Design Thinkmap data visualization technology: ... looking for some concrete examples of how ...
indirekt: 3-D Visual Navigation Of Information Spaces - Robin Good' ...
... Make sure you give it a good read as it contains valuable links to other very interesting information ... Visually Navigate Information Spaces and Taxonomies. ...
indirekt' (in-indirekt): GRAPH DRAWING and INFORMATION VISUALIZATION ?...in the next ...
... grade social studies and under- graduate visual art; using ... nice pictures of graph-structured information is a ... a map showing the user?s navigation through a ... [PDF] - ECDL 2002
... making decisions about presentation, visualization, and navigation,; ... It elucidates
thesaurus structure: Concept- term ... It presents selected thesauri as examples. ... - Document Visualization ... Finally, Section 6 presents examples of visualizations that derive from ... interaction type framework could ground work in visualization as a ... Thesaurus expansion. ...
indirekt: Fowler, R.H., W.A. Fowler, and B.A. Wilson. 1991. Integrating query, thesaurus, and documents through a common visual representation. Proceedings of the 14th Annual International ACM/SIGIR Congerence on Research and Development in Information Retrieval. ACM: New York, 142-151. - New Applications of Knowledge Organization Systems
... on the atomic elements of thesaurus data structures and ... also makes use of various visualization tools. ... relationships with other concepts and examples from real ... - Indices and Data Structures in Information Systems (PDF)
... Classical examples of ADTs are stacks, queues, trees, heaps, etc. ... thesaurus. ... Beyond is an outreach web site of the NSF Graphics and Visualization Center, which ...
26.5.04
von der TouchGraph Homepage
"The field of Graph Based Interfaces is still in it's infancy, partially because the main commercial applications such as InXight, TheBrain, and ThinkMap, are proprietary and thus do not allow for outside experimentation and modification of their code." (Quelle, gelb hinterlegter Bereich, zweiter Absatz; Daumennagel)
Treffer via site:w3.org
- thesaurus visualize graph implementation: 2 Treffer
- thesaurus vizualize: 3 Treffer
- multimedia thesaurus: 71 Treffer
- image-processing thesaurus: 3 Treffer
- stereographic thesaurus: 0 Treffer
- thesaurus 2D (2 Treffer)/3D (10 Treffer)
- virtual (37 Treffer)/virtuell thesaurus (0 Treffer)
- thesaurus GUI (11 Treffer)/UI (40 Treffer)/Benutzerschnittstelle (0 Treffer)/User Interface (61 Treffer)
- interactive thesaurus: 25 Treffer
- visual thesaurus: 62 Treffer
- graph-based information retrieval: 29 Treffer
- graph-based thesaurus: 3 Treffer
aus Springer-Link
"[Abstract] A graph based information retrieval framework for the visualization of clusters of related legal documents is proposed. Clusters are obtained through the analysis of the citations and topics of the retrieved documents.
Users, interactively, may refine their queries by selecting the graph nodes. Then, the context of the users interaction is calculated and it is shown in a tree-structure." Quelle: "An Interactive Graph Based Legal Information Retrieval System", Abscnitt "Abstract". – Das könnte zwar ein Hinweis auf ein enstprechendes System sein, doch der in dem Artikel angegebene Link führt, in Kombination mit Google's site:-Einschränkung und "Thesaurus" zu 0 Treffern. - Mag ja auch sein, dass ich kein Portugiesich kann... ;-) Tja, das tut mir dann auch leid, wenn ich selbst via Your Dictionary kein brauchbares Englisch-Portugiesisch-Wörterbuch finde, das mich a) nicht auf Portugiesisch empfängt, ohne Hinweis auf eine englische Version der Site, und b) keine Registrierung (!) für die Nutzung des Wörterbuches verlangt. Also, ich habe es auch mit "tesaurus" (ohne "h") verrsucht, aber das bringt auch nur 0 Treffer.
Users, interactively, may refine their queries by selecting the graph nodes. Then, the context of the users interaction is calculated and it is shown in a tree-structure." Quelle: "An Interactive Graph Based Legal Information Retrieval System", Abscnitt "Abstract". – Das könnte zwar ein Hinweis auf ein enstprechendes System sein, doch der in dem Artikel angegebene Link führt, in Kombination mit Google's site:-Einschränkung und "Thesaurus" zu 0 Treffern. - Mag ja auch sein, dass ich kein Portugiesich kann... ;-) Tja, das tut mir dann auch leid, wenn ich selbst via Your Dictionary kein brauchbares Englisch-Portugiesisch-Wörterbuch finde, das mich a) nicht auf Portugiesisch empfängt, ohne Hinweis auf eine englische Version der Site, und b) keine Registrierung (!) für die Nutzung des Wörterbuches verlangt. Also, ich habe es auch mit "tesaurus" (ohne "h") verrsucht, aber das bringt auch nur 0 Treffer.
es soll ja vorkommen, dass man selbst zu stark fokussiert
Neue Suchphrasen für Thesaurus-Visualisierung-Implementationen:
- thesaurus visualize graph implementation (566 Treffer via Google)
- thesaurus vizualize
- multimedia thesaurus
- thesaurus image-processing
- stereographic thesaurus
- thesaurus 2D/3D
- virtuell/virtual thesaurus
- thesaurus GUI/UI/Benutzerschnittstelle/User-Interface
- interaktiv/interactive thesaurus
- visuell thesaurus
- graph-based information retrieval
- graph-based thesaurus
- thesaurus-browser
Abonnieren
Posts (Atom)